Culture
The rules regarding what should be done and how it should be done.
Manage Your Culture or It Manages You
In order to manage an organization, we establish rules for behavior. We communicate these rules verbally, in writing, and through example. We enforce these rules through rewards and punishments. In essence, the culture we create through these rules controls or manages the organization. But do we manage the culture? Or does it manage us?
Once we establish the rules, we immediately begin losing control as people make small (and sometimes big) changes in their daily activities. People become frustrated when the rules don’t work very well and they make adjustments – they do something a little different via workarounds.
When people change what they are doing and/or how they are doing it, they are changing the culture. People who work closely together, such as a project team, police the rules and chastise members who overtly change them to meet individual desires (hence, secret workarounds). Likewise, larger groups, such as departments, also have their view of what is and is not acceptable. People who share a similar or common objective will tend to band together and embrace common rules of engagement (some sociologists call this the ‘Tribe Syndrome”). But these new rules that are being enforced may not be exactly what was originally intended or what management believes are being followed.
The more the rules prove inadequate for people to meet their accountabilities, the more frustrated they become. Small adjustments to remove the frustrations emerge. Acceptance grows within the team, but these new rules are not made known to others outside the group. New members that join the team are frequently shocked when they bring what they believe to be a better way of doing something into the group and are told without any discussion: “that’s not how we do things around here.”
In fact, the real rules of engagement are what the people perceive them to be. Bringing perceptions out for authentic discussion/modification of the rules is exceptionally difficult and very tricky. Face-to-face discussions do not work very well. There is too much fear of retribution. Those not directly experiencing the effects of the rules tend to quickly become resistive to these one-on-one suggestions. Many times, they take the easy way out by shooting the messenger as they think about the challenges of carrying rule change suggestions forward. Their resistance is fueled by not wanting to run the risk of falling into disfavor if their boss doesn’t understand enough about the processes to support the idea. No one wants to be the messenger accused of “shooting sacred cows.”
But just as important are how the rules are communicated – and not communicated. The way people behave influences what is done and how it is done. The components of these behaviors activate and move the culture. So, in essence, the culture manages the organization and we, hopefully, manage the culture.
To manage the culture, we first need to be able to measure it – to determine its effectiveness and influence throughout the organization. To enable this measurement, we can use a Culture Effectiveness Levels Model.
Culture Effectiveness Levels Model

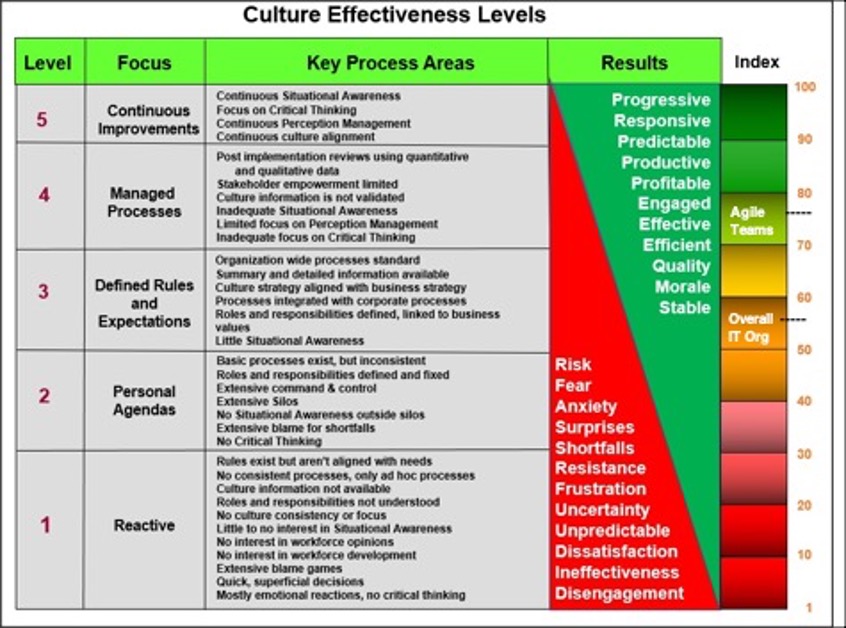
The culture drives the Focus people take in the organization that results in a level of effectiveness by emphasizing Key Process Areas.
The Results are the consequences of the key process areas. Realization of these consequences at each level are variable. For example, for a team in Level 1 we could have high levels of quality but may also have high levels of frustration and dissatisfaction. One can only imagine the increases in positive outcomes if the intense frustrations were removed. The Culture Effectiveness Levels Model provides a means for continuously measuring and managing the effects of the culture by work team. The 5 levels are:
Level 1 – Reactive
At this level, the rules of engagement consist mostly of verbal understandings. They are not aligned with the needs of the organization since those needs are not clearly defined. This is a very ‘individualistic’ environment where each person is bringing their perceptions of the ‘what and how’ to their jobs based strictly on previous experiences.
Level 2 – Personal Agendas
At this level, rules and responsibilities have been defined and are enforced with a strong command and control management style. Groups ‘refine’ the rules to suit their needs and strong silos emerge. Individuals bring their own interpretation of the ‘what and how’ but with an alignment towards their own agendas.
Level 3 – Defined Rules and Regulations
At this level, the ‘what and how’ are more focused on the goals and objectives of the organization. However, there is very little awareness of how well the rules fit the needs of the stakeholders thus causing considerable frustration and workarounds. Situational Awareness (knowledge of what is really going) is mostly gathered by asking subordinates questions and taking the answers at face value. There is very little Critical Thinking to validate perceptions.
Level 4 – Managed Processes
At this level, situational awareness and critical thinking begin to emerge but are inadequate for understanding the true culture. There tends to be considerable frustration amongst stakeholders leading to losses of productivity and poor morale. People learn to live within the system and the resistance to any change is severe.
Level 5 – Continuous Improvements
At this level, stakeholders become team members instead of victims of the organization. Situational awareness is a key focus, managers listen to their subordinates, innovation flourishes, failure is not a stigma but a learning process, frustration is low, morale is high. The culture changes by design not by accident.
Each team or group in an organization is at their unique level. Some groups may be at Level 5 while some in the organization may be at Level 1. These differences between groups lead to a tremendous amount of frustration amongst the players. It is not unusual in some cases for people to spend 90% of their time worrying about how to deal with their frustrations as they do battle with the functional areas affecting their job responsibilities.
The day-to-day activities of the workforce are complex and involve a number of functions. These functional areas enable an analysis of culture effectiveness.
Culture Functional Areas
There are numerous activities, functional areas, that affect the key process areas of Culture Effectiveness. Each organization is unique and is influenced by these functional areas in varying degrees. Among the functional areas that influence the effectiveness of the culture are:
- Accountability
- Action Bias
- Career Development
- Change Leadership
- Coaching
- Collaboration
- Communications
- Critical Thinking
- Curiosity
- Day-1 Culture
- Decision Making
- Emotional Intelligence
- Employee Value
- Employee Value Proposition (EVP)
- Empowerment
- Engagement
- External Perceptions
- Feedback
- Influencing Others
- Job Satisfaction
- Leadership
- Management Style
- Management Support
- Mentoring
- Motivating Others
- People Skills
- Perception Management
- Performance Management
- Politics
- Problem-Solving
- Productivity
- Risk Management
- Self-Development
- Strategy Development & Alignment
- Team Building
- Work Environment
- Working from Home (WFH)
The stronger these functional areas are perceived to be by the organization stakeholders, the more focused, consistent, and malleable the culture. There is apt to be less frustration experienced, more focus on the job, higher morale, and better stakeholder engagement. The better these functional areas are, the more likely for positive culture changes – and subsequently, increases in productivity and employee satisfaction.
Measuring the perceptions of stakeholders on these functional areas provides invaluable insights into work environment improvements and priorities. Here are the principles of how we go about it:
Collecting Perceptions
Collection of perceptions requires confidentiality if the data is to be accurate and represent the real feelings of individuals. An Electronic Interview that does not identify individuals but does identify work groups is the most effective.
First is to assess how leadership perceives the status and importance of the cultural functional areas in their organization. Second is to assess how the leader’s staff and entire organization perceive them. There WILL BE a gap of awareness that needs to be identified, validated, and closed.
Structuring Perception Data
Most useful is to structure the measurement data collection into a form that allows an overall summary of perceptions and provides a “drill down” for more precise detail. The drill down should be designed to show results by “demographics” that identify groups of people that work together, such as organizational units (divisions, departments, teams, work groups, etc.).
Other demographics such as locations, titles, responsibilities, number of years in a position, number of years with the company, and levels of experience help to identify and understand strong pockets of common perceptions that need attention. Demographics are designed to have enough members to protect individual identity. Anonymity is paramount for the collection of real perceptions of stakeholders.
Our perception data collection has two components:
- A question or statement for the respondent to evaluate by clicking responses on a Likert scale (a selection of choices from one extreme to another).
- An option for adding text for respondents to expand on their feelings, opinions, and suggestions about an issue.
The question or statement for evaluation is designed to capture how well an issue is perceived to be, how satisfied the respondent is with the issue as it affects them in doing their job. Initially, it is best to have rather general questions that will cover a variety of aspects of the issues. Respondents typically add more detailed aspects of their perceptions in the text box for a question.
More specific questions can be asked via repeat sessions based on the discoveries from the initial Electronic Interview. This is similar to face-to-face interviews where answers to questions lead to new questions. The difference is that our Electronic Interview provides anonymity (no recrimination for perceptions) and is not labor intensive. This process makes later follow-on face-to-face interviews with key people more effective as results of the anonymous interviews can be more openly discussed.
Example: ABC Company
As an example, we assisted an IT organization of 132 people perform a Culture Effectiveness assessment. We produced indexes representing the perceptions of the people with regard to their satisfaction with and importance of 18 culture functional areas chosen to best fit their specific concerns. On a scale of 1 (bad) to 100 (good):
- Satisfaction of 58
- Importance of 92
- Sufficiency of 66 – a numerical indicator of the distance between importance and satisfaction. When satisfaction and importance are equal, sufficiency is 100. An index below 100 represents a measure of insufficiency which is also an indication of the levels of frustration people are experiencing from inadequate culture functional areas.
Also, keep in mind that respondents were also adding their comments. In this case there were 242 comments clarifying concerns and offering recommendations for improvements.
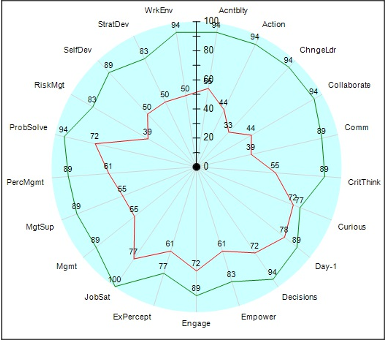
A visual representation (Figure 1) is more meaningful. In this case, the details of the above indexes are shown on a radar charts for each of the culture functional areas.
ALL (92, 58, 66)
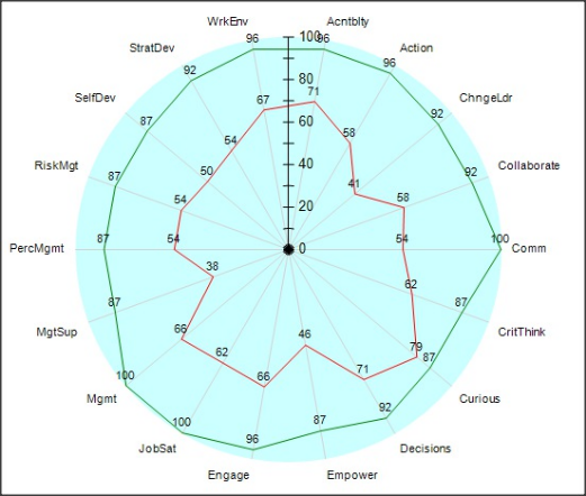
Perceived satisfaction is the red line (inside).
Perceived importance is the green line (outside).
The space between the lines can be interpreted as the amount of frustration people are having with each culture functional area.
We can see visually how the 58 index for satisfaction breaks down for each of the culture functional areas. We can see these issues are of considerable importance to everyone as well.
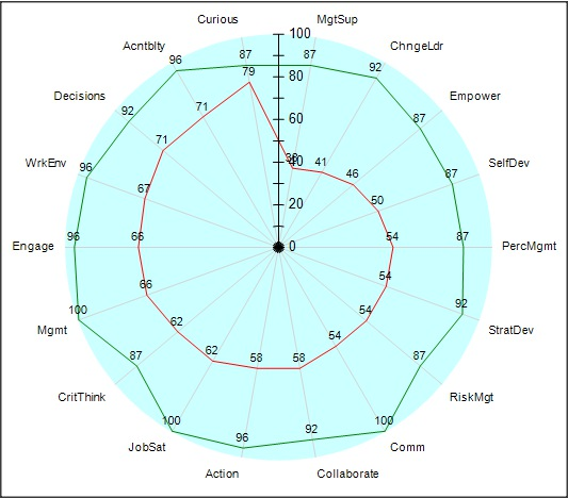
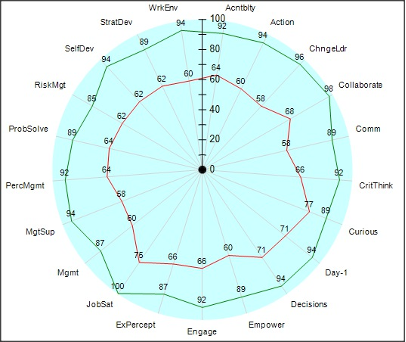
We can easily sort this chart to indicate lowest satisfaction areas to highest satisfaction. Now we can visually see what priorities the people believe should be addressed.
Sorting the chart (Figure 2) by satisfaction ranks the concerns:
- Management Support
- Change Leadership
- Empowerment
- Self Development
- Perception Management
- Strategy Development
- Risk Management
- Communications
- Collaboration
- Action Bias
- Job Satisfaction
- Critical Thinking
- Management Support
- Employee Engagement
- Work Environment
- Decision Making
- Accountability
- Curiosity
ALL (92, 58, 66)
The satisfaction index of 58 places the organization in Level 3 of our Model. Considering the perceptions of importance are at 92, our measure of sufficiency becomes 66. Still not a sterling score. This was a big surprise to the CIO!
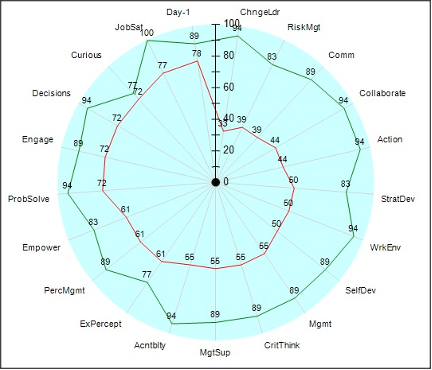
The CIO of this organization completed the electronic interview to record his perceptions of the culture. He wanted a picture of how his perceptions (Figure 3) compared to everyone else (Figure 4) – how accurate his situational awareness was of the culture effectiveness in each functional area. His responses were kept confidential, only available to him and no one else. He was surprised when he saw his perceptions compared to the responses of everyone else.
CIO (92, 76, 83)
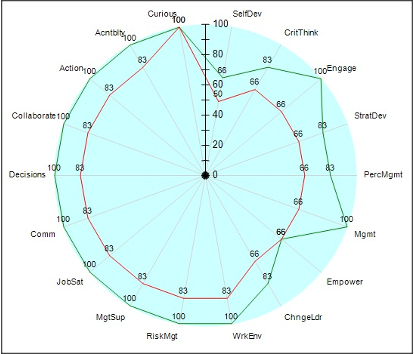
ALL (92, 58, 66)
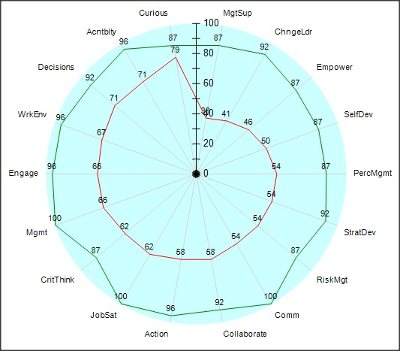
The CIO was surprised at how important empowerment was to everyone and how disappointed they were in management support. Drilling down further to see perceptions of the project managers Figure 5) and the developers (Figure 6):
Project Managers (89, 57, 68)
Developers (92, 64, 73)
It seemed strange that the perceptions of the developers were better than their bosses! This led to an interesting discovery. The Developers had two distinct approaches to software development, Agile and Waterfall. The Agile projects (Figure 8) viewed the culture much more effective than the Water Fall projects (Figure 7)! This brought the Developers average up considerably.
Comparing the responses of the two approaches and reviewing the comments led to an interesting discovery. The Agile culture was considerably different and much more effective than the Water Fall culture.
The Agile Manifesto was strongly embraced. The project managers, also the Scrum Masters, had all been certified in Agile and had a lot of experience embracing the principles. They were very protective of interference from others, especially from management.
Waterfall Teams (89, 57, 68)
Agile Teams (96, 74, 77)
The Waterfall Teams are more in line with the Project Managers in perceptions. Further examination revealed a lot of potential solutions that could improve the culture effectiveness of the other teams.
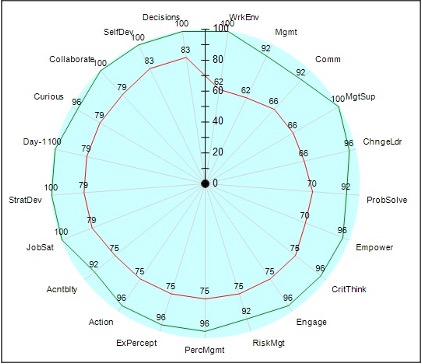
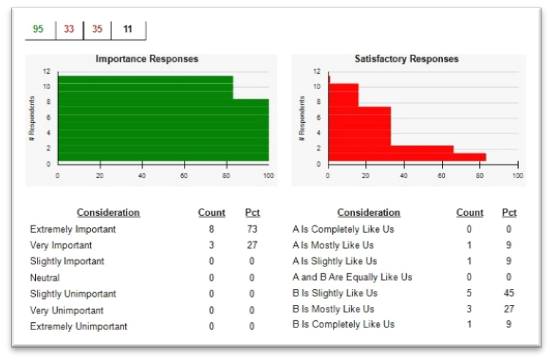
Other helpful analysis tools (Figure 9) enabled a closer look at the distributions of responses to each of the function areas. Drill downs to any demographic or combinations of demographics, revealed the distribution of responses without endangering anonymity:
The Culture Effectiveness Levels Model (Figure 10) was used to give an overall picture of the culture effectiveness levels and to reveal the gap between the Overall IT Organization and the Agile Teams. This model afforded a visual summarization of the indexes. It continued to serve as a “dash board” on which index values were posted monthly following successive Electronic Interviews and analyses.
Key Points
- The impact seriousness of workforce frustration cannot be over emphasized. Culture Function Areas that are perceived as inadequate disrupt workers from doing their jobs. This disruption creates varying degrees of frustration, but more damaging, unleashes emotional reactions that impede decision making, destroy cooperation, and eliminate creative thinking. (Thoughts on why this occurs are discussed in our Change Management Consideration Series, part 2: “The Nature of People – How Does It Affect What We Do?”)
- Perceptions form the basis for misunderstandings and culture contamination (creation of sub-cultures). They are our awareness and understanding of situations as determined by our senses (seeing, hearing, touching, and feeling). These impressions shape how we process information, how we reach conclusions, and how we form opinions. They constitute our version of the truth, our biases, our likes, and our dislikes. (Thoughts on the nature of perceptions are discussed in our Change Management Consideration Series, part 3: “Perceptions – The Unreal Truths”)
- Situational Awareness (SA) is essential to improving culture effectiveness. This entails understanding and validating how others perceive the culture.
Epilogue
The Culture Effectiveness Index project was done in two weeks. The Electronic Interview was open for one week and analysis of the results occurred over a one-week period.
The analysis included two days reviewing the response data (the Data Pack produced by the Electronic Interview system) and three days of selected focus groups (1–2-hour sessions) were held to provide additional input and focus on potential solutions.
To learn more about about Group Atlantic’s Perception Analysis Methodology that was used, Contact Us.