A WFH Effectiveness Index Case Study
Sustaining employee engagement while they are working from home (WFH) goes well beyond merely providing laptops, video conferencing and collaboration tools. Are your WFH Policies helping or hurting? How do you know? Employees need to feel, believe, and experience being a valued team member. One of the most effective ways to show workers their value is to solicit their participation in improving their WFH experience by using their views and opinions. Of course, you must be willing to take action based on the information provided. The following describes how a VP of Development and his boss the SVP-CIO used a WFH Effectiveness Index to identify and validate the root cause issues endangering their WFH program, and provide action options for improvements.
The Situation
It had been four weeks since ABC Company implemented a Working From Home (WFH) Program for the Information Technology organization. For VP of Development Tom and his boss SVP-CIO Justin, it had quickly turned into a world of the unknown laced with frustration, apprehension, lack of control, stress and fear. And, it had been getting worse by the day.
When the CIO Justin had asked how the WFH Program was going – Tom didn’t really know. Most all of the usual beacons he had used to judge effectiveness of his areas of responsibility had disappeared. No face-to-face staff meetings or follow-up meetings. No walking around observing his department employees and teams in action. No social contact to judge morale. No impromptu one-on-one conversations around the water cooler and most of all, no body language to observe. He was in the dark.
Coordination, ensuring trust, validation of information for decision making, establishing a common ground needed for team problem solving, and supporting people to overcome their reluctance to say what was on their mind had always been a challenge. Now it had become impossible. It was a new world, a new environment – and Tom had needed to quickly come up with a way to measure it and control it.
The Index
Tom came up with an Index to measure the effectiveness of the WFH Program – an Index that would not only measure effectiveness but would help prioritize and drive improvement actions. This technique would also create a secure foundation for supporting WFH control over his areas of responsibility, which included 70 people organized into three development groups and eight work teams with three teams embracing Agile and the others using Waterfall (WF) development methodologies.
With his Index approach, Tom was able to give SVP-CIO Justin a status of the WFH program. It had an Effectiveness Index of 53 (out of 100). It wasn’t going well at all. The Index was a roll-up of critical things that were essential to an effective WFH Program. Going down the roll-up provided the intelligence needed to improve the index by enabling Tom to identify and validate problems, determine solutions, establish solution focus, and determine priorities.
Tom felt the quality of this intelligence about the WFH Program was rock solid. It was based on what the stakeholders involved were actually experiencing and what they said they needed, with the bark off. This was their ground truth, given anonymously, without fear of retribution. Participants were not identified individually and from the results, it seemed that they had no reluctance in calling out real problems and slaughtering “sacred cows” that had become barriers to them in doing their jobs under the WFH Program. This is how he did it.
The Methodology
Tom broke down the idea of an Effectiveness Index into component parts or Critical Success Factors (CSFs). These would be the critical areas that had to go right for his department to achieve their commitments. These CSFs would be the operational enablers supporting his employees in doing their jobs. Tom chose ten:
- Communications – accurate, timely, and truthful exchanges of information within teams, across teams, and up/down the organization.
- Action Bias – avoidance of procrastination in decision making.
- Change – involvement of stakeholders in developing and implementing new and/or modified procedures and processes.
- Empowerment – allowing people to make decisions without constant approvals.
- Employee Value – recognition of employee contributions.
- Leadership – providing guidance to remote employees by clarifying direction and expectations
- Management – involvement and subsequent support of management.
- Productivity – the changes in productivity as new processes are implemented
- Work Environment – establishing and maintaining working conditions that allow individuals to concentrate on their tasks and develop new skills without inappropriate distractions.
- Critical Challenges – identification of the most critical challenges to the WFH program.
Tom would use web-enabled anonymous electronic interviews to have his employees evaluate each of the CSFs. An issue for each CSF would be defined in the form of a question or statement for evaluation. The participant would be able to score the status of each issue and would be given a place below the question where they could provide detailed clarifications and suggestions for improvements. The text comments would provide a basis for employee participation in developing appropriate action plans for improving the WFH Program. This text data could also be used to improve questions/issues for additional rounds of electronic interviews, just like results obtained in staff meetings helped him focus the next staff meeting agenda.
In thinking about the relevance of the questions he had developed, Tom decided to add a second evaluation for each question. He wanted to know how important each issue was to the respondents in doing their jobs. That way, not only could he validate his intelligence gathering questions, but solutions could be focused for areas where they were most important and really needed.
The importance consideration gave rise to another idea. If something was evaluated as mediocre to a respondent, but not important to them in doing their job, then it could be considered sufficient for that respondent. So, Tom decided to use the difference between satisfaction and importance as another index, sufficiency. Tom now had three parts to his Effectiveness Index: Importance, Satisfaction, and Sufficiency.
These scores would provide an Effectiveness Index measure for each CSF and could be rolled up for an overall Index.
Intelligence Gathering
Tom created a question or issue statement for each of the ten CSFs. Not only did he want everyone to evaluate each issue in terms of satisfaction and importance, but he wanted them to expand on their thoughts about the WFH Program these issues stimulated. The good, the bad, and the ugly could be described in a comments box with no fear of retribution.
A rather subliminal positive feature of Tom’s approach was that it involved the employees in defining the problems as well as the potential solutions. Tom’s experiences had been that the most effective change management had occurred when employees had participated in defining the change and in essence had become “partners” with, instead of victims of, the change agents.
Tom also included a couple of demographic questions for respondents to select their department, their team, and their level of responsibility. He made sure each demographic group would have enough members to preserve respondent anonymity. His plan was to learn the specifics of problems experienced by groups working together in order to apply focused and meaningful solutions and didn’t need to identify individuals.
The Electronic Interview
Tom’s intelligence gathering involved his 8 development teams and the associated management chain under his responsibility, a total of 70 people. They all responded to the anonymous electronic interview. There was a reason for 100% participation.
Tom’s electronic interview system provided each respondent with a confidential ID code – a random generated 6-digit number. Even though the interview was short, a participant could exit the interview and return later to finish. They would input their code and be returned to their specific interview. Once submitted, the respondent could download a pdf copy of their responses that included a coded receipt for their participation. When Tom invited his employees to participate, his email stressed how critical it was for them to join in by evaluating and clarifying the problems and concerns they had with the working from home (WFH) Program. Consequently, and in order to protect anonymity of respondents, if everyone didn’t participate their managers might be asking for them to produce their receipt. After all, an all hands meeting meant just that! Mandatory attendance!
Tom sent an email to each employee giving them the link to the electronic interview. He committed to all the participants that they would be getting feedback from the responses and would be kept apprised of actions being planned (based on their responses) to improve the WFH Program. The interview was open from Monday through the following Saturday. Data was to be downloaded for analysis on Sunday. Tom planned to let his managers know the response numbers each day. By Thursday, all had responded.
The Results:
Tom’s system structured the data for easy analysis and included a variety of graphs and drill downs by demographic areas and by CSFs. Tom was ready to meet with CIO Justin after one day of analysis.
The CIO Justin was shocked when Tom told him the WFH Effectiveness The CIO Justin was shocked when Tom told him the WFH Effectiveness Index from the electronic interviews came out to be 53 out of 100. Justin’s expectation was for the high 80’s! Tom was expecting mid 80’s! Tom’s four Directors had not been quite so optimistic suggesting Tom’s thoughts were a “little high” although they seemed unwilling to venture an estimate. Their reticence reminded Tom how important anonymity was if you want people to give you their true thoughts on a controversial matter.
Tom started with the “bottom line”:
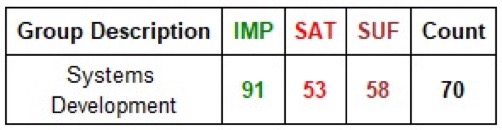
Tom explained that 70 people responded (count) and he had three measures (color coded on all his charts and graphs):
- The Importance (IMP) – average value from all respondents (Count) on a scale from “not important at all” (1) to “extremely important” (100).
- The Satisfaction(SAT) – average value from all respondents (Count) on a scale from “completely unsatisfactory” (1) to “extremely satisfactory” (100).
- The Sufficiency (SUF) – Average value from all respondents (Count) on a scale from “totally insufficient” (1) to “completely sufficient” (100)
Tom noted that in the case of Sufficiency, it could go over 100 (overly sufficient) which would indicate that the satisfaction with a situation exceeded the perceived level of importance.
Tom’s thoughts were that the satisfaction level should closely match the importance level for maximum effectiveness of the WFH Program (Sufficiency of 100 or more). So what was going badly to drive the low satisfaction and sufficiency numbers?
Justin’s first question to Tom was, “What is causing the low numbers?”
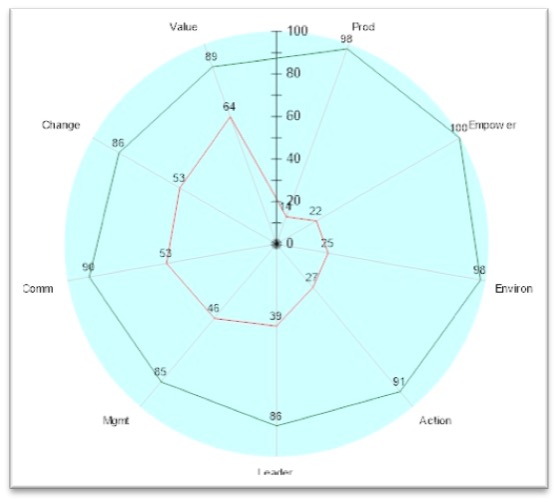
To answer that question, Tom showed his boss Justin a radar chart (Exhibit 1). It showed the levels of Satisfaction (in red) and Importance (in green) for each of the 9 CSFs. The space between these two lines was a visualization of the Sufficiency – the larger the space, the less the sufficiency.
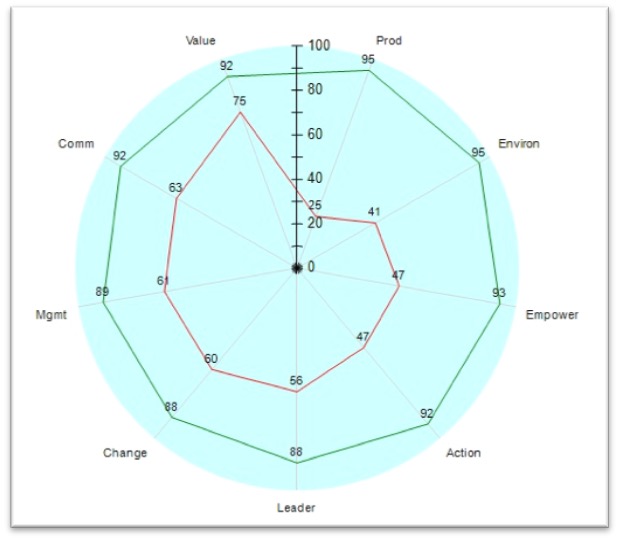
Sorted in order of least satisfaction, Justin could see that Productivity, in the opinion of the 70 respondents, was the biggest problem, with a level of Importance at 95, a level of Satisfaction at 25, and with a level of Sufficiency at 26. The CSFs in order of least sufficiency were :
- Productivity (95, 25, 26) – the changes in productivity as new processes are implemented
- Work Environment (95, 40, 42) – establishing and maintain working conditions that allow individuals to concentrate on their tasks and develop new skills without inappropriate distractions.
- Empowerment (93, 48, 52) – allowing people to make decisions without constant approvals.
- Action Bias (92, 48, 52) – avoidance of procrastination in decision making.
- Leadership Guidance (88, 57, 65) – providing guidance to remote employees by clarifying direction and expectations
- Change (88, 60, 68) – involvement of stakeholders in developing and implementing new and/or modified procedures and processes.
- Management Support (88, 61, 69) – involvement and subsequent support of management.
- Communications (91, 64, 70) – accurate, timely, and truthful exchanges of information withing teams, across teams, and up/down the organization.
- Employee Value (91, 75, 82) – recognition of employee contributions.
- Critical Challenges – a list where all 70 respondents selected the most critical challenges to the WFH, then ranked from highest concern to lowest concern (not shown on the radar chart, see Exhibit 5).
The levels of importance indicated the respondents felt the CSFs were very important to the program, as did Tom. The satisfaction experienced by the stakeholders was a different story.
Justin asked Tom, “Are these perceptions consistent among all the organizational groups, or is there a particular area or development team driving these low scores?”
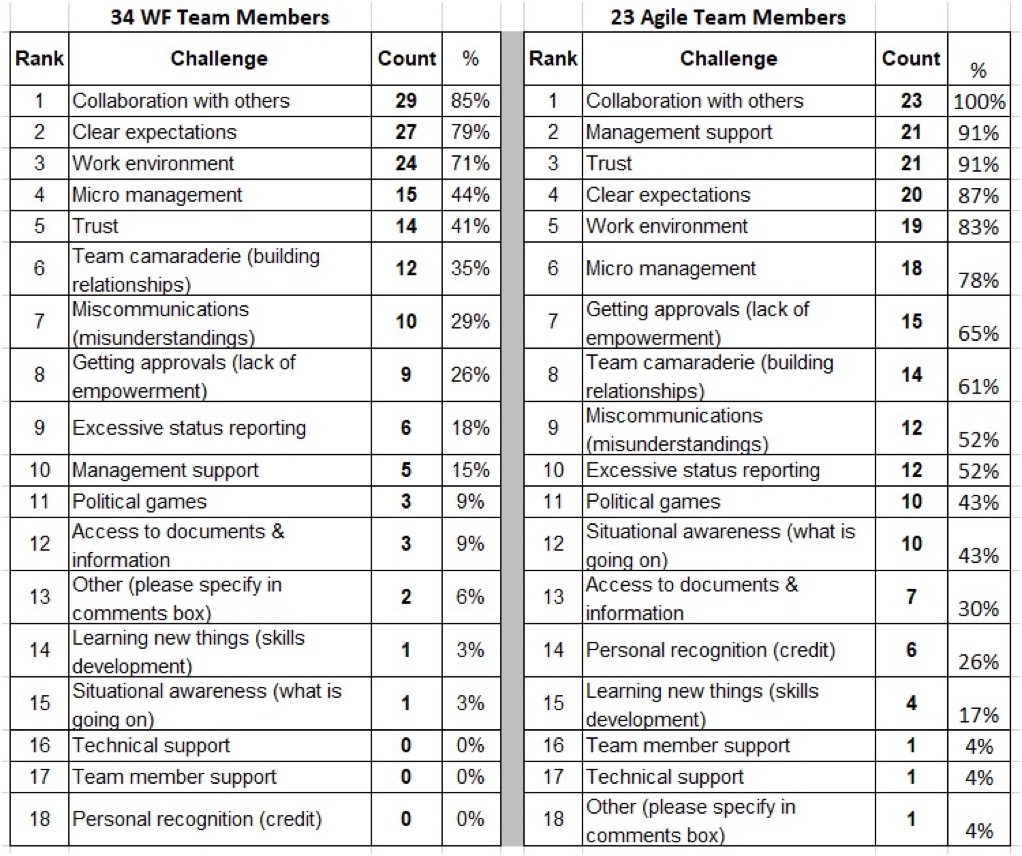
Tom brought up the next chart. It showed the Indexes (sorted by sufficiency) for the entire Systems Development department with a breakdown for each organizational unit. Tom also included the Index for the teams using water fall and the teams using agile. The agile teams were the most affected by the WFH Program.
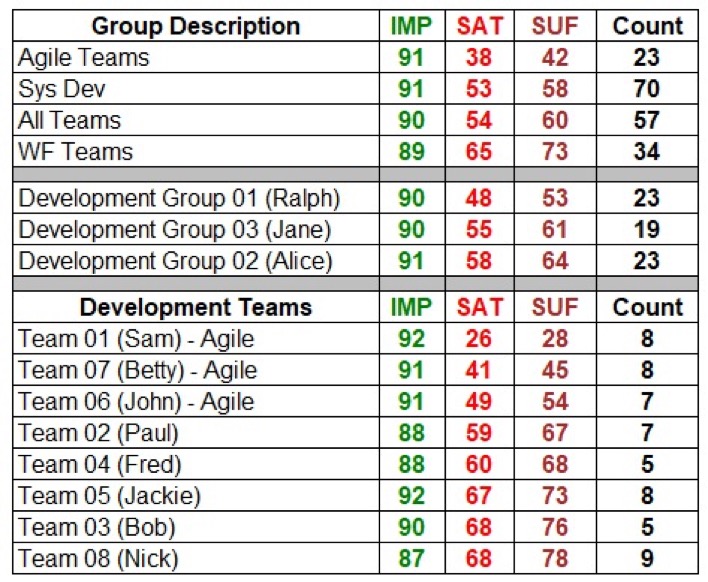
Before the WFH Program, the agile teams, especially Team 01 (Sam) were the most productive of all the teams in Systems Development. Their users were making the majority of the positive comments about the support from IT since the introduction of agile. Sam’s team also had the most critical project for the company.
Justin was stunned. His most important project had the lowest sufficiency with the WFH Program! He asked Tom, “Do you have some detail on the team responses?”
Tom then said, “Let me show you how the waterfall and agile teams responded.” He brought up the next two charts showing the index numbers for each of the CSFs.
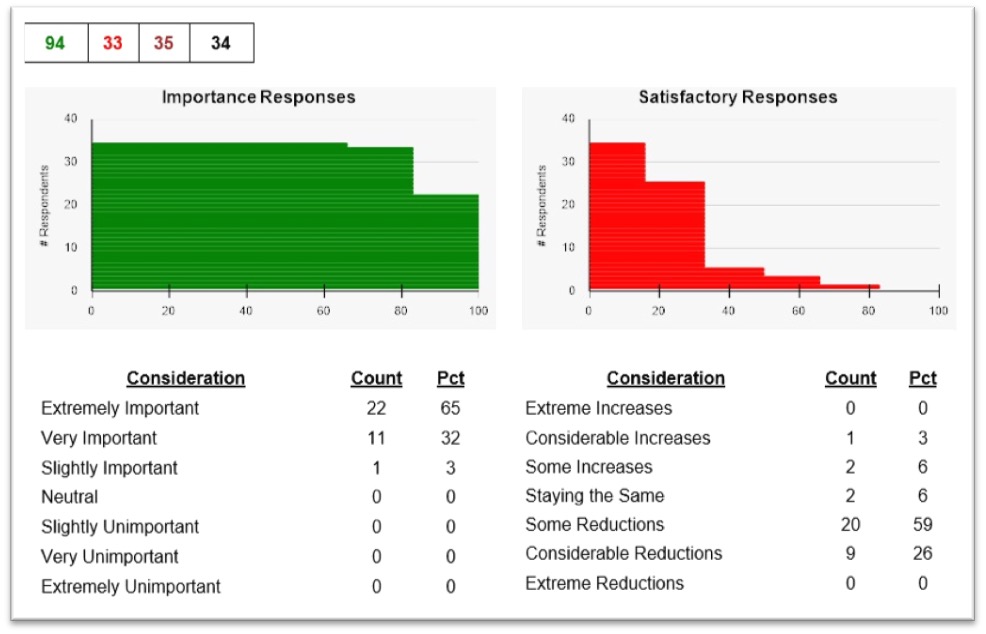
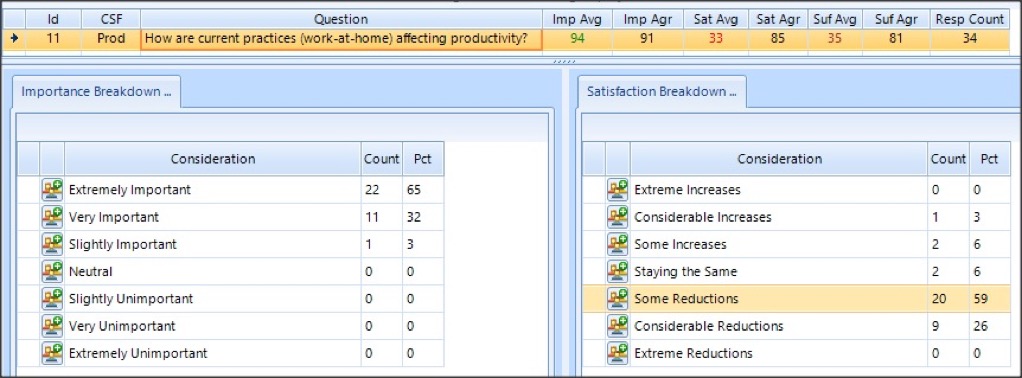
The teams (34 team members) utilizing waterfall (WF) methods had an index (89, 65, 73):
1. Productivity (94, 33, 35)
2. Work Environment (93, 48, 52)
3. Action Bias (90, 62, 69)
4. Empowerment (88, 64, 73)
5. Management Support (86, 71, 83)
6. Change Management (86, 71, 83)
7. Leadership Guidance (85, 76, 89)
8. Communication (90, 76, 84)
9. Employee Value (90, 82, 91)
Tom said, “Four serious problem areas requiring immediate analysis: Productivity, Work Environment, Action Bias, and Empowerment.” Justin agreed. Tom pointed out that the agile teams really needed to be addressed in all areas.”
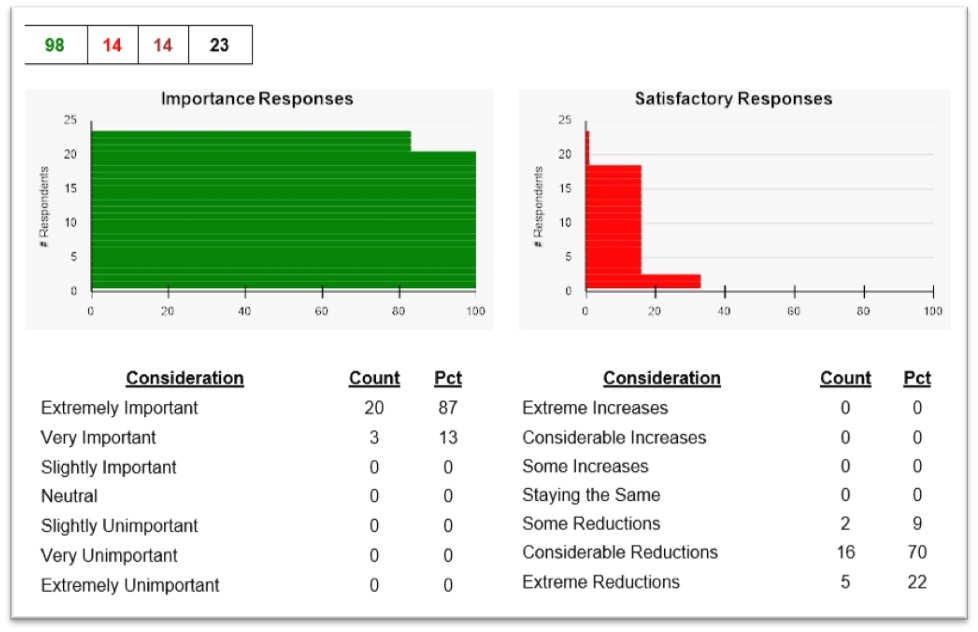
The teams (23 team members) utilizing Agile methods had an Index (91, 38, 42):
1. Productivity (98, 14, 14)
2. Empowerment (100, 22, 22)
3. Work Environment (98, 25, 26)
4. Action Bias (91, 27, 30)
5. Leadership Guidance (86, 39, 45)
6. Management Support (85, 46, 54)
7. Communications (90, 53, 59)
8. Change Management (86, 53, 62)
9. Employee Value (89, 64, 72)
Tom said, “The Four most serious problem areas are: Productivity, Work Environment, Action Bias, and Empowerment.” Justin agreed and added his concern over the low indexes for Leadership Guidance, Management Support, Communications, and Change Management!
The Agile Teams appear to be devastated by the WFH Program as it is currently operating. Justin asked Tom, “What were the specific responses from the agile teams to the Productivity question and did they have any interesting comments?” Tom had the answer – he showed Justin the following detailed responses distribution chart with key comments listed.
The Analysis
Productivity – the question on the electronic interview was:
How are current practices (work-at-home) affecting productivity?
For the agile team members:
Key Confidential Comments Agile Teams – Productivity
23 I am spending a lot of time wondering how to respond to some of the confusing directives I get from my manager in web meetings. Impossible to interact with everyone else on the call. When questions are asked, made to feel stupid or foolish for asking. Not getting anywhere near the work done as before working from home. Very depressing.
18 This work from home is a nightmare. I am lost. My usual confidants are not available except by appointment. I am very unsure of what to do most of the time.
30 Management control needs to lighten up and let people do their jobs. Work from home has made management paranoid and increased their control activities. No trust in what employees are doing.
84 A lot is not working so well. Web meetings not well organized and go too long. Ramble. People appear bored and not involved (video). Lots of distractions – such as people leaving their mics on with background noise screwing things up. Backgrounds in some individuals video is distracting.
96 Communications needs to get straightened out. Too many delays in getting critical information.
120 Current practices of outside daily interference are destroying the effects of agile practices. Status reporting is getting more frequent and in more detail – killing productivity. Also, micro management is interfering.
Justin certainly didn’t like the responses of the agile teams on productivity. But he sure liked the data! Talk about “ground truth” – here were the unadulterated convictions of those directly producing the productivity of his department. These were the people that generated the results he was accountable for.
The consistency of responses among the 23 team members across 3 different teams was also striking. His first reactive thought of ‘who said it’ evaporated. Anyone who wanted to point a finger would need a big finger. It also told him it wasn’t just a one team anomaly. It was rampant throughout the agile teams.
Then there were the comments. Justin thought about what the comments would be if he asked individuals what the problems were. His managers had already told him nothing, because they didn’t really know and were more likely guessing. Logically identifying problems and defining problem causes was typical when people weren’t sure and didn’t have adequate information. But getting visibility directly from those on the front line was strong and convincing. Furthermore, the detail and suggestions indicated that they knew things could be done differently and were asking for approvals and help – they wanted to participate in making things better and were more than ready to change.
Justin asked Tom, “What about responses from the WF Teams? What was the distribution of their responses to productivity?”
Tom showed Justin the following charts for the teams using the water fall development approach.
Productivity – results for the WF Teams:
Key Confidential Comments WF Teams – Productivity
41 Some inconveniences but generally working out.
52 Many distractions have been eliminated by working from home.
61 More positive than negative. Lot of inane interruptions have been eliminated. Collaboration has taken a hit. Could use more consistent guidelines on communications amongst others regarding technical issues resolutions.
72 Things have slowed down. Harder to be sure it is safe to move ahead on projects. When collocated, it was easier to touch base and verify directions.
108 We have had to modify the department directives to be more effective for us. No conference calls without video, no one-on-one calls without video, consistent agenda for conference calls, etc.
291 Lot of inconveniences
Justin could see it was also bad but not like with the agile teams. The comments didn’t seem as desperate either. Still, however, WFH was taking a toll. Justin asked Tom, “What do you think is different for the WF teams than the agile teams?”
Tom said, “Agile, by definition, requires close collaboration and team interactions. WF approaches tend to have more independent contributors not requiring constant team member interactions. Things tend to happen more spontaneously with agile than WF. It appears that the WFH Program has destroyed the heart of the agile approach, collaboration and interaction. But still, the WF folks have the same problems, just maybe not so directly detrimental to their productivity as the agile team members. I have another view of the data that is online that shows the demographics of specific responses.”
Tom said, “Agile, by definition, requires close collaboration and team interactions. WF approaches tend to have more independent contributors not requiring constant team member interactions. Things tend to happen more spontaneously with agile than WF. It appears that the WFH Program has destroyed the heart of the agile approach, collaboration and interaction. But still, the WF folks have the same problems, just maybe not so directly detrimental to their productivity as the agile team members. I have another view of the data that is online that shows the demographics of specific responses.”
“By clicking on that line highlighted in yellow, I can view the demographics of those 20 people (Exhibit 8).
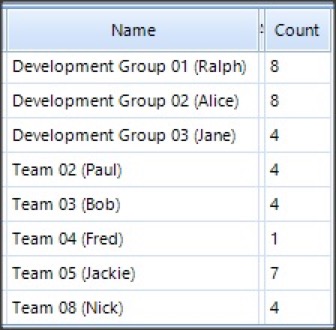
As you can see, they are spread across all three development groups and the 5 WF teams. The project that Team 04 is working on has the least team interaction requirement. Some of Team 05 (Jackie’s team) members have already been working at home. So, they are telling us that their previous working from home has been adversely affected by the WFH Program just introduced. They might be a good source to help us identify the problems WFH has introduced that they didn’t have before.
Justin made a note to make this one of the priority actions going forward.
Justin asked, “What are the columns on Exhibit 7 – Imp Agr, Sat Agr, and Suf Agr?”
Tom said, “Those are agreement indexes for importance, satisfaction and sufficiency. If the specific responses were all the same, agreement index would be 100. Those indexes show high level of agreement on importance with larger dispersion on satisfaction and sufficiency.”
Justin was surprised by the low indexes and especially by the Productivity detail. It was hard to take. He had done so much to ensure control was maintained over the development teams in moving to the WFH Program. It seemed as though it wasn’t working, and things had gotten much worse. But he began to see Tom had come up with an intelligence gathering technique to fuel a very effective recovery.
Tom said, “Let me show you one other picture. Our 10th CSF asked the team members to identify the challenges they were experiencing due to the WFH Program. Their responses are very informative as to the potential causes for the productivity drops.”
It was easy to see how the challenges the teams were experiencing would lead to productivity problems. It didn’t take much to connect the dots. Before the WFH Program, things were progressing nicely. Justin was beginning to see how his additional attempts to maintain control over working from home might be causing problems.
Justin started thinking about some of the things he had initiated to ensure the WFH Program didn’t result in paid vacations for team members.
- Daily morning reports on tasks planned for the day.
- Daily evening reports on accomplishments for the day.
- Group conference calls for more than 5 participants had to be submitted to his admin assistance who would set them up and send out invitations
- Report required summarizing every conference call (must include action items)
Tom had argued these types of directives would destroy the empowerment necessary for the agile framework. It would also destroy morale and show a lack of trust on management’s part. But Justin was accustomed to Tom’s “people orientation” and felt it usually interfered with the necessary task orientation. Overriding Tom had become a frequent event for Justin on this issue.
Justin was new to the company, just completing his first year. President Brandon had brought him in as CIO to improve the effectiveness of IT. He had inherited a technically strong but not very responsive IT organization. Justin’s predecessor had promoted Tom to VP of Development two years ago and although the quality of systems was unquestioned, continuous schedule slippages had been the demise of his predecessor.
Justin had come to realize that Tom was one the most knowledgeable employees about all the systems as well as the technology on which they were based resulting in high quality but late delivery. Justin had been putting heavy pressure on Tom to improve systems development timeliness and when Tom requested the go-ahead to embrace Agile approaches, Justin had succumbed quickly to Tom’s logic by given his approval. Justin knew very little about the agile concepts, but Tom seemed very knowledgeable. Almost immediately, things had started to improve – best measured by the users of I/S beginning to give a little praise for a change. Progress could be seen. Even President Brandon had complimented Justin on the positive progress. Then came the required WFH Program.
Justin was not intimidated by serious problems or difficulties. He was inspired by them. At the moment, he was somewhat shaken as he began to realize his initial WFH Program actions had not been based on the necessary foundation of information and feedback to ensure his path was the right one. He had detected that Tom and his management team seemed less than excited about many of Justin’s directives, but challenges from them were minimal. Justin was a strong, Driver/Type A, personality and once his mind was made up, he didn’t listen very well, or so he had been told. When the WFH Program came about, he was determined to maintain control over IT and continue the positive developments, so he had become more personally involved than ever.
It was one thing to hear bad news from a direct report or some of the managers, but it was really different when the news came directly from those involved first hand – and all of them besides! And the consistency of agreement among the team members was unnerving to say the least. Justin could see the true meaning of the term “ground truth!” He said to Tom, “Let’s start defining what actions we need to take to get things moving again.”
Tom, on the other hand, was more inclined to think about identifying and validating what the electronic interview participants had indicated instead of taking immediate actions based on this preliminary view of responses.
Tom suggested: “Let’s define the problem areas we see so far and then continue going through the rest of the CSFs and see what other issues come up. We can also start verifying what we have discovered so far and see how the problems interact among the CSFs. Then, let’s get some other key managers together and show them what we have and get their reactions. The goal would be to define, validate, and prioritize the actions we might take – like a straw man – then have our group beat on them. Then I suggest we pass these ideas by the team members, along with a summary of the electronic interview results to get them onboard as participants with our plan.”
Justin’s first thought was, this is typical Tom – delay taking action and keep enjoying the analysis of data! However, in this case it seemed to make sense. Besides, since Justin was very surprised at what this first data analysis had uncovered, his curiosity of what else might come out was pretty strong. He agreed with Tom.
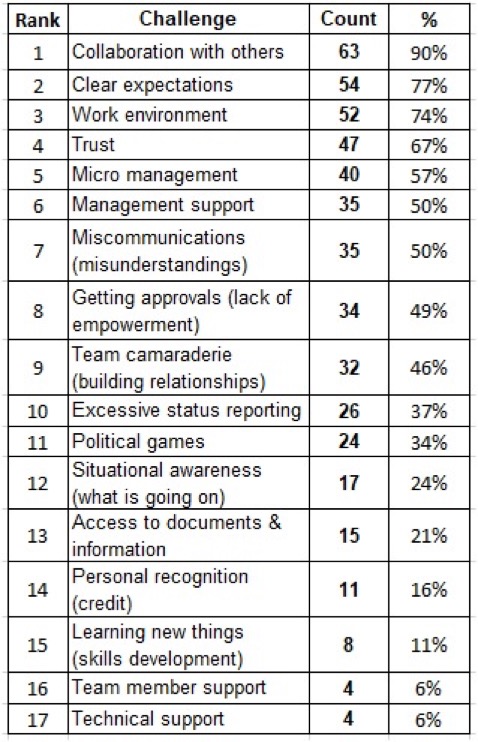
Tom said, “It seems like so far, the most serious problems to productivity might be identified best by the development team responses to the challenges question (Exhibit 9a). If we look at those challenges, combined for all 70 people in the department (Exhibit 9b), we get a good list of problem areas or themes that give us a structure for putting together our action plans.”
Tom continued, “As we go through the rest of the response data, we can see how the CSFs contribute to these themes. We might come up with different themes as well. We can also find out more detail about what it is the people view as causing problems and what they might recommend be done. This would help us make sure we have the right problems defined and the right priorities as well.”
Justin immediately saw the value of this approach. In looking at the first challenge of collaboration that 90% of the 70 people had selected, he could already envision CSF interactions that would influence or contribute to that concern. Justin agreed.